


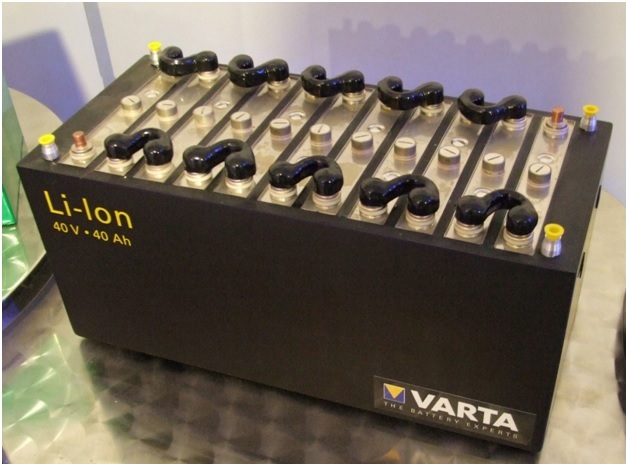
Lithium-ion batteries
Lithium-ion batteries have become the most preferred option for powering consumer electronics in the recent past. Other technologies like electronic cars are also considering adopting them as their primary means of power capacity their products. Lithium-ion batteries have high energy density, require very minimal maintenance and have very low rates of self-discharge. Owing to these advantages, many appliances have embraced lithium-ion batteries. Unfortunately, just like any other battery, they finally degrade with time. To better understand the calendar and life cycle of Lithium-ion batteries, many researchers have conducted numerous tests. One prominent research of this nature was conducted by Bor Yann Liaw et al at Sandia National Laboratories.
The research
The team of researchers conducted Accelerated Life Tests (ALT) at the Sandia National Laboratories to establish battery life and come up with predictive models. In these ALTs, battery cells were subjected to different temperatures for thermal aging. The cells were subjected to temperatures of 25°C, 35°C, 45°C and 55°C. To estimate the degradation due to thermal aging the cells were gauged for power supplies fade and capacity fade as functions of aging.
The cells were also exposed to aging at different states of charge (SOC) to enable the assessment of degradation on composition. The SOC’s investigated were 60%, 80%, and 100%. The cells were further subjected to cycling so as to investigate their dependence on cycling conditions.
Arrhenius equation
Thermal aging forms the basis for Arrhenius type analysis of the thermally activated process in degradation. Arrhenius behavior is captured using the Arrhenius equation expressed as below;
A= exp(-/RT)
In this case, A stands for the quantity of interest (this typically related to the rate of change of the property in the system), represents the pre-exponential term (this depicts intrinsic value of such a property), represents the activation energy, R represents the universal gas constant while T represents absolute temperature.
The experimentation process
The test procedure followed were those described in the Partnership of New Generation Vehicles manual developed by the Department of Energy (DE). When not under test, the cells were stored at 10°C. When conducting accelerated life tests, 3-5 cells were used, they are all exposed to similar test conditions under thermal stress to accelerate degradation. After every four weeks, the cells under test were brought out for reference performance test. (RPT). As described in the manual, RPT includes hybrid pulse power characterization (HPPC), AC electromechanical impedance spectroscopy (ESI) and rate capacity determination (at C/I and C/25). During RPT, the temperature is kept at 25°C.
The cells are removed from aging the moment they meet the end of test (EOT) condition. During this particular research, the temperature aged cells were subjected to 36 months of aging while the higher temperature aged cells were subjected to 20 weeks. Power fade was determined using the characterization of power capability as reached on by HPPC.
Arrhenius behaviors and capacity fade
The results obtained illustrate that when cells are subjected to temperature aging over a period of time, power degradation occurs in a linear manner that is characterized by multiple stages. Each of the multiple stages exhibits distinct dependence on time. This was evidenced by the fact that when the values obtained during each RPT are plotted in a power fade versus logarithmic time curve for all SOCs, there are distinct slopes in the obtained curves. It was further noted that the curves of the cells subjected to higher SOC and higher temperature, behaved a little differently compared to the rest. The curves were missing the middle transition stage.
The power fade data (in a logarithmic scale) obtained from cells exposed to same aging conditions was plotted against the reciprocal temperature based on Arrhenius equation. This was done for the three different SOCs. Least-square linear curve fitting was applied to come up with a slope for each curve. The slope was then used to obtain the activation energy for each stage of degradation. Owing to limited information obtained from the microcalorimetry measurements, the team decided to focus on 80% SOC.
At the beginning of the experiment, the cells were aged at 80% SOC, they were then degraded thermally after which they started to exhibit descending activation energy. At the end of the 4th week, the activation energy was 50.3 kJ/mol. At the end of the 12th week, the activation energy had fallen further to 42.5 kJ/mol. By the end of the 32nd week, the activation energy had fallen further to 28.6 KJ/mol. These values coincide with the trend of the changes in power fade degradation for the cells with SOC of 80%.
The C1 and C25 capacity fade for the three different SOCs over the period of 36 weeks was plotted. It was established that the multistage behavior exhibited by the resulting curves is more or less similar to the power fade trend. In the Arrhenius curves of both C1 and C25 for the cells at 80% SOC illustrated a different behavior for at 25°C from those at a higher temperature. The change of activation energy for C1 and C25 fade was also determined and it was observed that the first three results of C1 fade and similar to those derived from power fade an implication that they both share the same origin. The activation energy of C25 fade obtained between the 12th and 20th-week intervals was found to coincide that of power fade, suggesting that they might be coming from the same origin during the transition stage.
The change in interfacial impedance of cells aged at 80% SOC for 12 weeks was determined and was found to yield an activation energy of 32.2kj/mol. This value is very close to those obtained from C25 fades during the first stage of degradation. The static heat generation of two cells with 80% SOC and thermally aged at between 25°C and 65°C was recorded. The resulting data were then plotted against reciprocal temperature. The result exhibited linear dependency indicating a constant Arrhenius activation energy of order 48.0 kJ/mol and 61.8 kJ/mol respectively. The average value is 54.9 Kj/MOL which closely resembles that observed in the initial stage of degradation as obtained from power and C1 capacity fades.
Conclusion
Based on the data obtained it was concluded that degradation follows a multi-stage process with a middle transition stage being exhibited when cells are exposed to lower temperature aging. It was also established that activation energy derived from Arrhenius analyses on power fade, static heat generation, and C1 capacity fade yielded a closely similar value of 50-55Kj/mol in the beginning stage suggesting that they could be coming from the same origin.
Based on the fact that energy derived from the interfacial impedance change and C25 fade was closely similar, there are high chances that they may be related. The activation energy derived from power fade and C25 capacity fade also yielded a closely similar value indicating that they could be following the same degradation mechanism.
Related posts:
 Schneider Electric Product | Schneider Electric XB4 at Enrgtech
 QUALCOMM inspiring the future of IoT
 Connecting Devices to the IoT with Wi-Fi – IoT Applications
 Aliasing Effects in Digital MEMS Sensors
 Higher Efficiency and Power Density with MOSFETs
 5 Different Types of Electrical Conduits to Protect Electrical Wirings
 UNDERSTANDING CONNECTORS AND THEIR SPECIFICATIONS
 What are the Electrical Complications in Old Homes?
 3D-Printing and Additive Manufacturing Of Electronics
 Microchip UTC2000: USB Type-C Controller
 Introduction to Connectors: Types and Functions
 DC Motors: Why do DC Motors have Brushes?


